Binge Analytics
Building a BI Dashboard SaaS for Restaurants — A decision system providing real-time profit KPIs, funnel analytics, and multi-branch tracking.
Project Matrix
- ClientBinge Analytics Dashboard
- IndustryTechnology
- Year2026
Technologies
01 / Case Study Overview
The Narrative
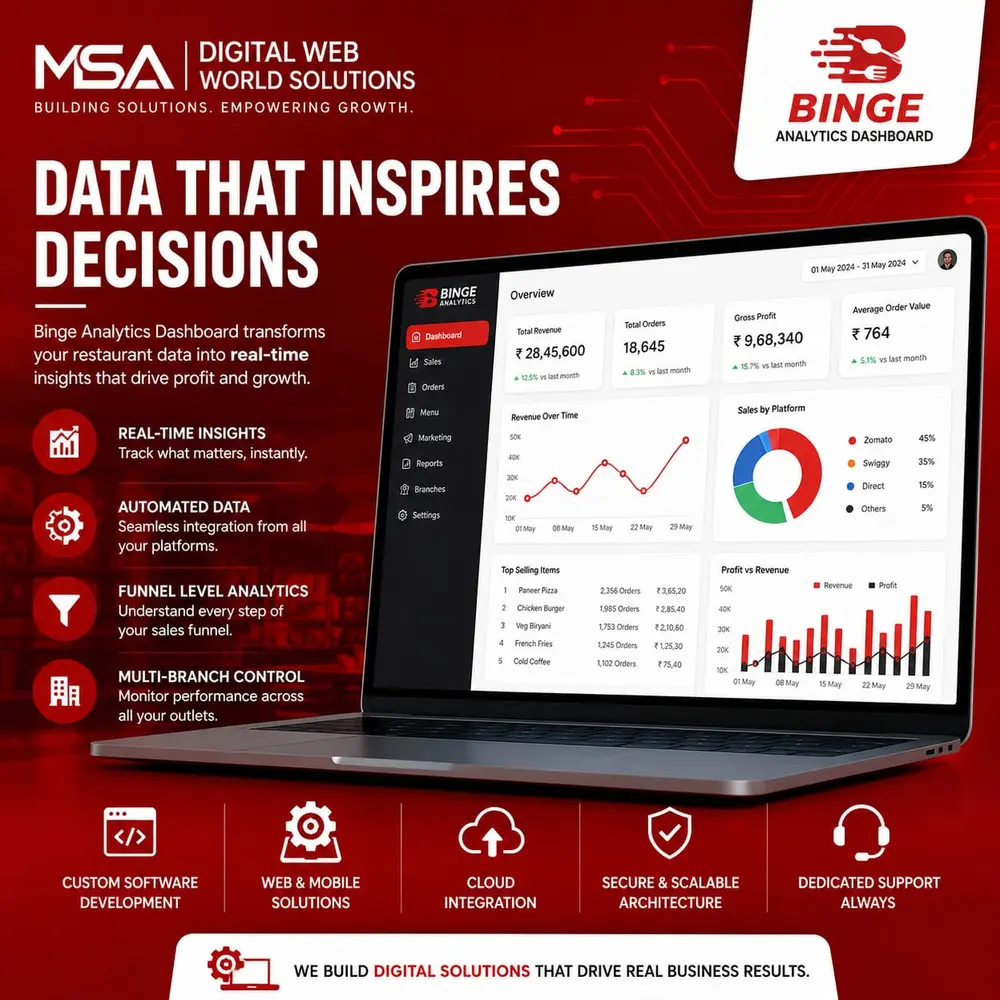
After working on our latest project (Binge Analytics Dashboard), one thing is very clear: Most restaurant owners are sitting on data… but making ZERO use of it. They track: ✔ Orders, ✔ Revenue, ✔ Discounts, ✔ Ads spend. But they don't track what actually matters: → Which items are killing profit, → Which offers are silently burning margins, → Which platform (Zomato/Swiggy) is actually profitable. So we decided to build something different: Not just another dashboard — but a decision system. Binge Analytics provides automated data from multiple platforms, real-time KPIs (profit, not just revenue), funnel-level insights, and multi-branch tracking.
02 / The Challenge
The Bottleneck
Most restaurant owners track surface-level metrics like order volume, revenue, discounts, and ad spend, but remain blind to hidden profit leaks. Operating across fragmented platforms like Zomato, Swiggy, and direct channels makes it difficult to assess true item-level profitability, calculate net margins after platform commissions, or compare performance across multiple outlets.
03 / The Solution
Our Strategic Response
MSA engineered Binge Analytics — a modern BI Dashboard SaaS specifically tailored for single and multi-branch restaurants. The platform automates data ingestion across delivery channels, calculates real-time profit KPIs (focusing on net profit over raw revenue), delivers granular funnel analytics, and provides executive multi-branch oversight in a single high-performance dashboard.
04 / Execution Framework
Development Process
We executed an end-to-end product engineering workflow: conducting restaurant analytics research, designing an intuitive data visualization UI, building multi-platform REST API ingestion pipelines, engineering high-speed financial metric calculation engines, implementing secure multi-tenant data architecture, and deploying a responsive desktop & mobile experience.
05 / Feature Architecture
Key Specifications
Automated Data Aggregation (Zomato, Swiggy & Direct Channels)
Real-Time Net Profit KPIs (Focusing on Net Profit vs. Just Gross Revenue)
Item-Level Margin & Profit Leakage Analytics
Offer & Discount Margin Impact Tracking
Funnel-Level Customer Behavior & Sales Insights
Multi-Branch Performance & Outlet Benchmarking
Responsive Executive & Operational Dashboards
06 / Business Impact
Verifiable Outcomes
Successfully transformed complex restaurant data into a real-time decision system • Empowered restaurant owners to uncover margin-draining menu items and unoptimized offers • Delivered clear channel-by-channel net profit visibility • Streamlined multi-outlet oversight into a unified visual portal.
Visual Presentation
Project Gallery
Interactive high-resolution media captures of the project modules. Click any layout below to open the media inspector.